
Marine Pollution Management Group
The Port and Airport Research Institute (PARI) is developing an integrated environment for simulating the water environment with the "Ise Bay Simulator" at its core, which has been developed through research commissioned over many years by the Chubu Regional Development Bureau of the Ministry of Land, Infrastructure and Transport in accordance with the Ise Bay Restoration Action Plan.Eco-PARI
System name: Ecological hydrodynamic simulation system Ecological hydrodynamic simulation system by PARI Common name: EcoPARI
This system enables users to create calculation conditions, perform calculations, and check (visualize) the results.
Background
The Marine Pollution Control Research Group of the Port and Airport Research Institute (PARI) is conducting research to elucidate the mechanisms of changes in physical, chemical, and biological parameters such as flow, temperature, DO, phytoplankton, blue tide, red tide, and higher ecosystem (fish and bivalves), which are important indicators for diagnosing and evaluating the marine environment in coastal and estuarine areas, and to provide recommendations for environmental measures. The group has been conducting research on the regeneration of Ise Bay. The group has been developing an inner bay water quality complex ecosystem model, known as the "Ise Bay Simulator," to quantitatively predict and evaluate the effects of environmental improvement measures on water quality and ecosystems under a study commissioned by the Chubu Regional Development Bureau of the Ministry of Land, Infrastructure, Transport and Tourism in accordance with the Ise Bay Restoration Action Plan (Tanaka et al. 2011; Tanaka Tanaka et al. 2011; Tanaka and Suzuki 2010). The Ise Bay Simulator models not only the lower-order food chain from phytoplankton to zooplankton, which has been generally modeled, but also the higher-order food chain from zooplankton to fish and the corrosive chain from detritus to bacteria, which are features not found in other numerical water environment simulation models. It has features not found in other numerical simulation models of aquatic environments. The Ise Bay Simulator has been applied in coastal and estuarine areas and lakes in Japan, including Ise Bay, Tokyo Bay, Osaka Bay, Hiroshima Bay, Suruga Bay, and Lake Shinji (Hafeez and Inoue 2021; Inoue et al. 2015; Tanaka et al. 2011; Tanaka and Suzuki 2010). Due to these features, accuracy, and track record, the Ise Bay Simulator has been evaluated as a reliable model by the government, especially by the Ministry of Land, Infrastructure, Transport, and Tourism (MLIT).
In parallel, we have developed tools necessary for calculations using the Ise Bay Simulator, such as tools for creating boundary condition data (conditions at the boundary between the sea surface and atmosphere, conditions of river inflow, and conditions at the connection with the open ocean (Pacific Ocean in the case of Ise Bay)), and tools for analyzing and visualizing calculation results. We are also developing a GUI tool that can be used consistently with those systems.
Through research commissioned by the Kanto Regional Development Bureau and the Kinki Regional Development Bureau of the Ministry of Land, Infrastructure, Transport and Tourism, the application of these simulation systems has spread to other sea areas such as Tokyo Bay and Osaka Bay. The name "PARS" was chosen to indicate that the simulation system can be used outside of the Ise Bay area, and to promote awareness of the system as an integrated simulation system. The name EcoPARI was chosen because it is a simulation system for ecological hydrodynamics developed by the Port and Airport Research Institute (PARI). We will continue our research and development with the aim of developing a system that can be utilized by industry, academia, and government.
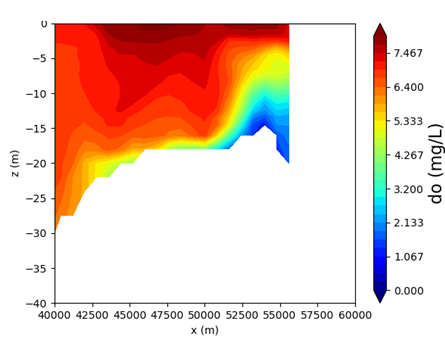
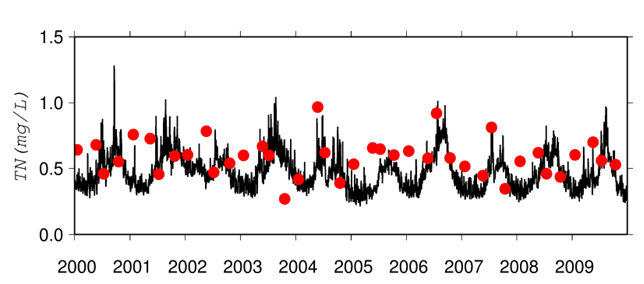
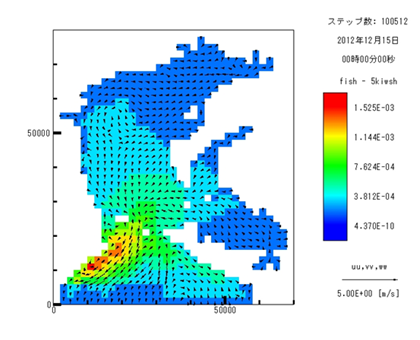
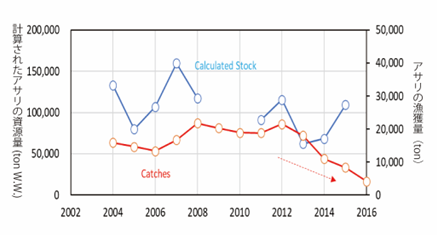
Phenomena that can be studied with EcoPARI-simulator EcoPARI-simulator can simulate physical quantities such as water temperature, salinity, and flow direction and velocity in coastal and estuarine areas and lakes. In addition, EcoPARI-simulator can simulate biochemical quantities such as anoxic water mass (Figures 2, 3, and 4), nutrient salts (Figure 5), and red tide (phytoplankton concentration). In addition, a fish ecosystem model (Inoue and Komuro 2020) and a bivalve model (Tsurushima, Nagao, and Nakata 2019) such as clams and white clams are incorporated to reproduce and predict fishery resources (Figures-6 and 7).
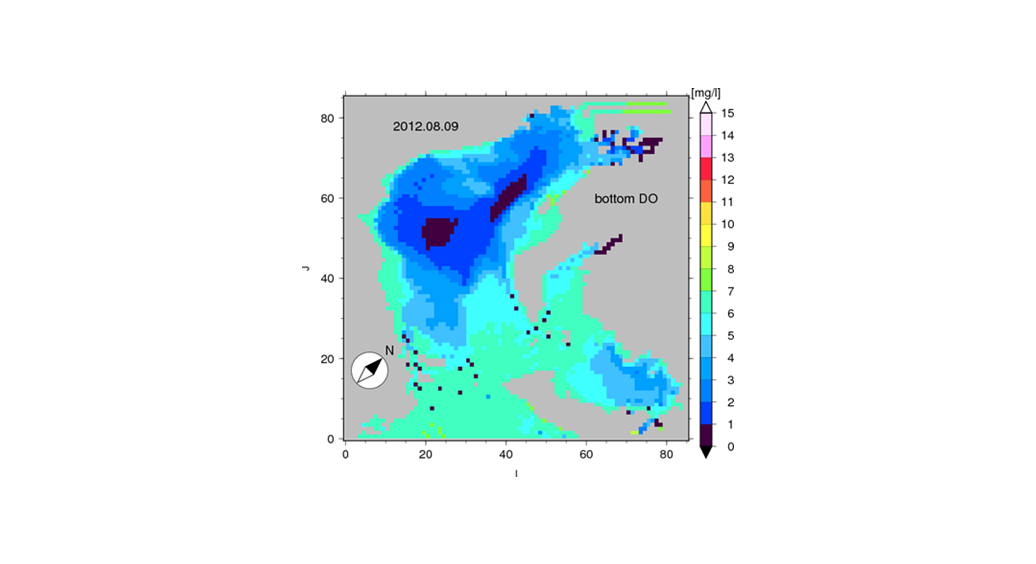
Blue indicates low oxygen concentration.
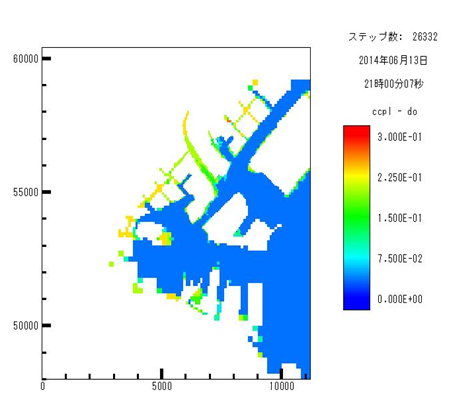
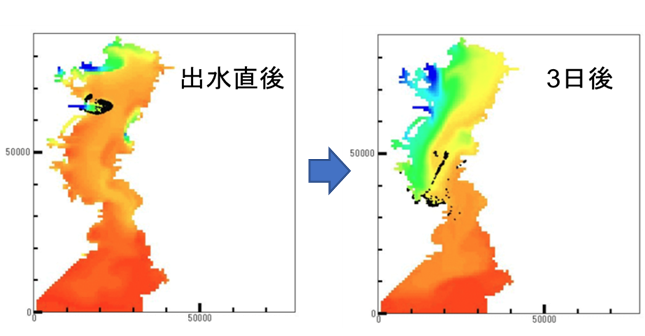
By setting a finer grid in the calculation, it is also possible to simulate detailed topography such as in hollows and in harbors (Figure-4). EcoPARI also incorporates optional models. A particle tracking model (Emina et al. 2021) is implemented to simulate advection, dispersion, and drift of suspended debris, marine oil spills, and suspended larvae (Figure-8).
When numerically simulating physical, chemical, and biological quantities in coastal and estuarine areas, it is desirable to reproduce atmospheric conditions with high accuracy. For this purpose, we have constructed EcoPARI-WRF, a system that allows input of information such as wind and temperature calculated by the meteorological model Weather Research and Forecast: WRF (Skamarock et al. 2008) as atmospheric boundary conditions (Hafeez et al. 2021; Matsuzaki et al. 2021). We are also constructing EcoPARI-SWAN, which combines the third-generation wave estimation model SWAN (Simulating WAves Nearshore). In EcoPARI-simulator, there is a trade-off between a finer computational grid and computational load (computation time). Therefore, we are constructing EcoPARI-remesher, which selects the fineness of the computational grid according to the need. EcoPARI also introduces a data assimilation system (Matsuzaki and Inoue 2022; Matsuzaki and Inoue 2020; Matsuzaki and Inoue 2022). Data assimilation is a method of fusing observations into numerical simulations and modifying the results of numerical simulations. The ensemble Kalman filter (EnKF), one of the data assimilation methods used in this study, makes it possible to compute correlations between variables from an ensemble of models, allowing us to take advantage of observed quantities of information and estimate unobserved information It can be used to estimate unobserved information. As a concrete example, data assimilation can use information from observations such as water temperature and salinity at monitoring posts to improve the results of numerical simulations of dissolved oxygen, phytoplankton, etc., as well as water temperature and salinity at locations remote from the monitoring posts.
EcoPARI is also equipped with EcoPARI-GA, a parameter adjustment system based on a genetic algorithm, which enables objective parameter adjustment by comparing observed values with numerical simulation results. By utilizing the EcoPARI functions described above, it is possible, for example, to study the effects of shallow water creation, to study the effects of the construction of a breakwater at the mouth of a bay, and to study the effects of the management and operation of a sewage treatment plant.
Acknowledgments.
This research was supported by the Port and Harbor Bureau, Chubu Regional Development Bureau, Kanto Regional Development Bureau, and Kinki Regional Development Bureau of the Ministry of Land, Infrastructure, Transport and Tourism.
References.
Hafeez, Muhammad Ali, and Tetsunori Inoue. 2021. "Determination of Flow Characteristics of Ohashi River through 3-D Hydrodynamic Model Water 13 (21): 3076. doi:10.3390/w13213076.
Hafeez, Muhammad Ali, Yoshiyuki Nakamura, Takayuki Suzuki, Tetsunori Inoue, Yoshitaka Matsuzaki, Kangnian Wang, and Abdul Moiz. 2021." Integration of Weather Research and Forecasting (WRF) Model with Regional Coastal Ecosystem Model to Simulate Hypoxic Conditions." Science of The Total Environment 771 (June): 145290. doi:10.1016/j.scitotenv.2021.145290.
Matsuzaki, Yoshitaka, Takashi Fujiki, Koji Kawaguchi, Tetsunori Inoue, and Takumu Iwamoto. 2021. "Application of the WRF Model to the Coastal Area at Ise Bay," Science The Total Environment 771 (June: 145290. Coastal Area at Ise Bay, Japan: Evaluation of Model Output Sensitivity to Input Data." Coastal Engineering Journal 63 (1): 17 -doi:10.1080/21664250.2020.1830485.
Matsuzaki, Yoshitaka, and Tetsunori Inoue. 2022. "Perturbation of Boundary Conditions to Create Appropriate Ensembles for Regional Perturbation of Boundary Conditions to Create Appropriate Ensembles for Regional Data Assimilation in Coastal Estuary Modeling." Journal of Geophysical Research: Oceans, March. doi:10.1029/2021JC017911.
Skamarock, William, Joseph Klemp, Jimy Dudhia, David Gill, Dale Barker, Wei Wang, Xiang-Yu Huang, and Michael Duda. 2008. "A Description of the of the Advanced Research WRF Version 3." doi:10.5065/D68S4MVH. Inoue, Tetsunori, Y. Nakamura, K. Suzuki, Y. Tanaka, and R. Naito. 2015. "Development and Application of a Water Quality and Ecosystem Simulation Model (Ise Bay Simulator)." HEDORO, no. 123: 34-40.
Inoue, Tetsunori, and Takashi Komuro. 2020. "Analysis of Low-order Ecosystem and Fishery Catch by a New Fish Ecosystem Model." Papers of the Port and Airport Research Institute, no. 1368: 38.
Matsuzaki, Y., and T. Inoue. 2020. "Investigation of Computational Conditions of Data Assimilation for Flow Analysis of Closed Water Area by Ensemble Kalman Filter. Port and Airport Research Institute of Japan, no. 1367: 35.
Matsuzaki, Y., and T. Inoue. 2022. "Year-round Data Assimilation Experiment by the Regional Coastal Data Assimilation Method Implemented in the Ise Bay Simulator: Perturbation of Boundary Conditions to Create Appropriate Ensembles in Coastal and Estuarine Areas. Port and Airport Research Institute Report 61 (1): 1-37.
Tanaka, Y., Y. Nakamura, K. Suzuki, T. Inoue, and Y. Nishimura. 2011. "Development of a Floating Ecosystem Model Considering Microbial Loops." Port and Airport Research Institute Report 50 (2): 3-68.
Tanaka, Y., and K. Suzuki. 2010. "On the Development of a Three-Dimensional Coastal Flow Model for the Calculation of Density Flow Upwelling. Port and Airport Research Institute Report 49 (1): 3-25.
S. Emina, T. Ogura, T. Kitadai, N. Uragaki, T. Inoue, and T. Komuro. 2021. "Survey of Microplastics in Yokohama City (6th Report) - Monitoring of Microplastic Drift of Nojima Beach -." Yokohama Institute of Environmental Sciences Bulletin, no. 45: 21-30.
Tsurushima, D., K. Nagao, and K. Nakata. 2019. "A Study on Prey Deficiency of Clams in Ise Bay Using Numerical Simulation." JSCE Transactions on Coastal Engineering B2 (2): 75 (2): I_1111-I_1116. doi:10.2208/kaigan.75.I_1111.

Creating technologies that Contribute to the World
National Institute of Maritime, Port and Aviation Technology
Port and Airport Research Institute
3-1-1 Nagase,Yokosuka City, Kanagawa Prefecture, 239-0826 Japan Phone +81-46-844-5010
Copyright © Port and Airport Research Institute. All rights reserved.