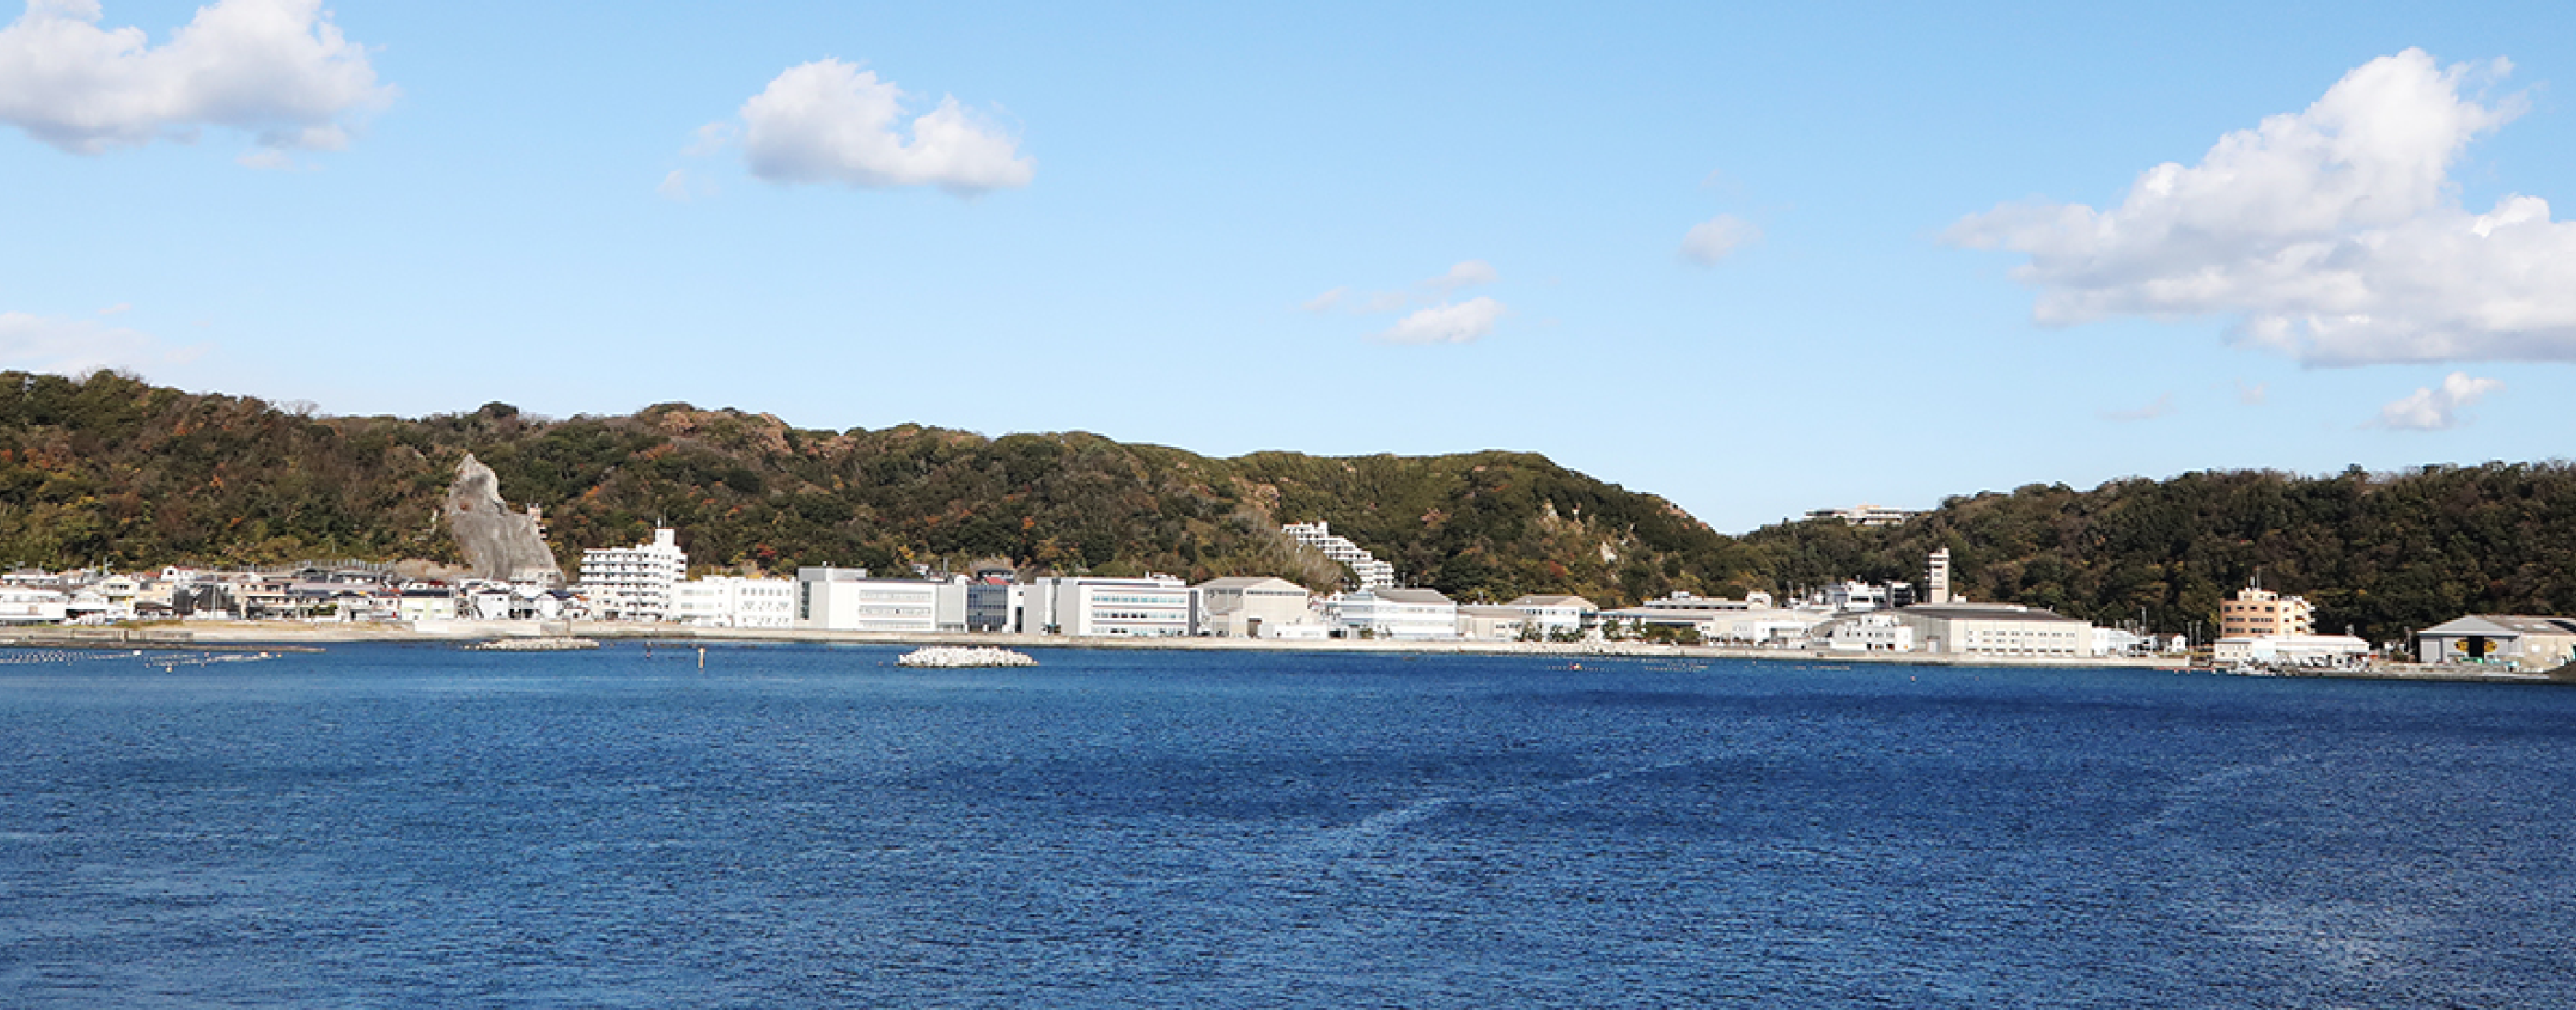
Marine Environment Control System Department
Ise Bay 2014 data
| Period |
2nd layer and 3rd layer | 2nd layer and 5th layer | 2nd layer and 12th layer | Remarks |
|---|---|---|---|---|
| Dec, 2011 | MP4/5,482KB | MP4/5,432KB | MP4/5,321KB | Dec,11,17,20-23,25-30:No data |
| Nov, 2011 | MP/6,238KB | MP4/6,226KB | MP4/6,079KB |
Nov,1-11:No data |
| Oct, 2011 | MP4/2,653KB | MP4/2,978KB | MP4/2,584KB |
Oct,11,13,15-31:No data Oct, 6,12,14:No data |
| Sep, 2011 | MP4/6,404KB | MP4/6,332KB | MP4/6,198KB | Sep,1,10-18:No data |
| Aug, 2011 | MP4/6,069KB | MP4/6,463KB | MP4/6,327KB |
Aug,10,18-25,27-31:No data Aug,26:Bad data |
| Jul, 2011 | MP4/6,522KB | MP4/6,463KB | MP4/6,327KB |
Jul,1-8:No data Jul,20-30:No water quality data |
| Jun, 2011 | MP4/6,069KB | MP4/6,055KB | MP4/5,930KB | Jul,20-30:No data |
| May, 201 | MP4/9,183KB | MP4/9,129KB | MP4/8,893KB | May,7-11:No data |
| Apr, 2011 | MP4/7,168KB | MP4/7,144KB | MP4/6,965KB | Apr,1-9:No data |
| Mar, 2011 | MP4/5,624KB | MP4/5,615KB | MP4/5,498KB | May,18-31:No data |
| Feb, 2011 | MP4/5,696KB | MP4/5,684KB | MP4/5,584KB | Feb,1-9:No data |
| Jan, 2011 | MP4/4,784KB | MP4/4,717KB | MP4/4,525KB | Jan,6-10,24-31:No data |
*The flow of the second layer measured by ADCP is showed by red color, and the flow of the other layer by blue color.
*In the map, circles mean observed points of temperature and salinity, and crosses mean non-observed points of current.


