
Major Research Understanding the characteristics of liquefied-ground deformation through a density matching technique
Previous research pointed out that liquefied ground behaves similarly to a viscous fluid; however, a method of estimating such viscosity has not been established. In this research, we aimed to understand the deformation characteristics of liquefied sand ground from a microscopic viewpoint, i.e. the interaction between sand particles and pore water, through experiments using a density matching technique.
We selected five resins with different densities (polypropylene, polystyrene, nylon, delrin, and teflon; density = 0.90 to 2.15), formed each of them into a spherical shape with a diameter of 1 to 2 mm, and then used these balls instead of sand. We changed the material densities to replicate the disappearance of interparticle force during liquefaction phenomena.
We used a rheometer to measure shear resistance, and then quantified the velocity dependence (viscosity) of shear resistance. As a result, we found that dense particles show stronger velocity dependencies (Figure 1 and 2).
We used a high-speed camera to observe the deformation field and confirmed the following mechanism: deformation regions expanded with increasing rotational speed of vanes and then the shearing resistance increased. Hereafter, we will conduct experiments using a wider range of specimens to systematically understand the phenomena.
Figure 3.
Velocity distribution (Velocity was normalized with the rotational speed of the vane tip.) Deformed area expands with increasing rotational speed of the vanes (right figure).
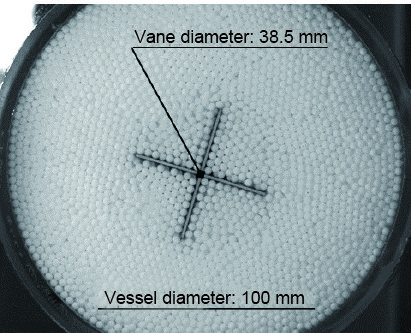
Figure 1.
Viscosity measurement by a rheometer
Resistance is measured against the rotation of the vanes.
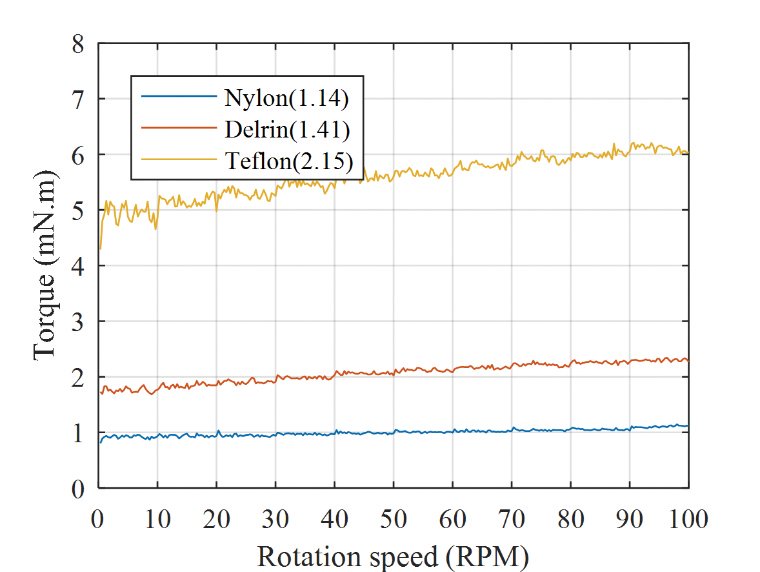
Figure 2.
Relation between shear resistance and rotational speed of the vanes
With heavy-density particles (teflon), the shear resistance increases with the rotational speed of the vanes (resulting in a high apparent viscosity).
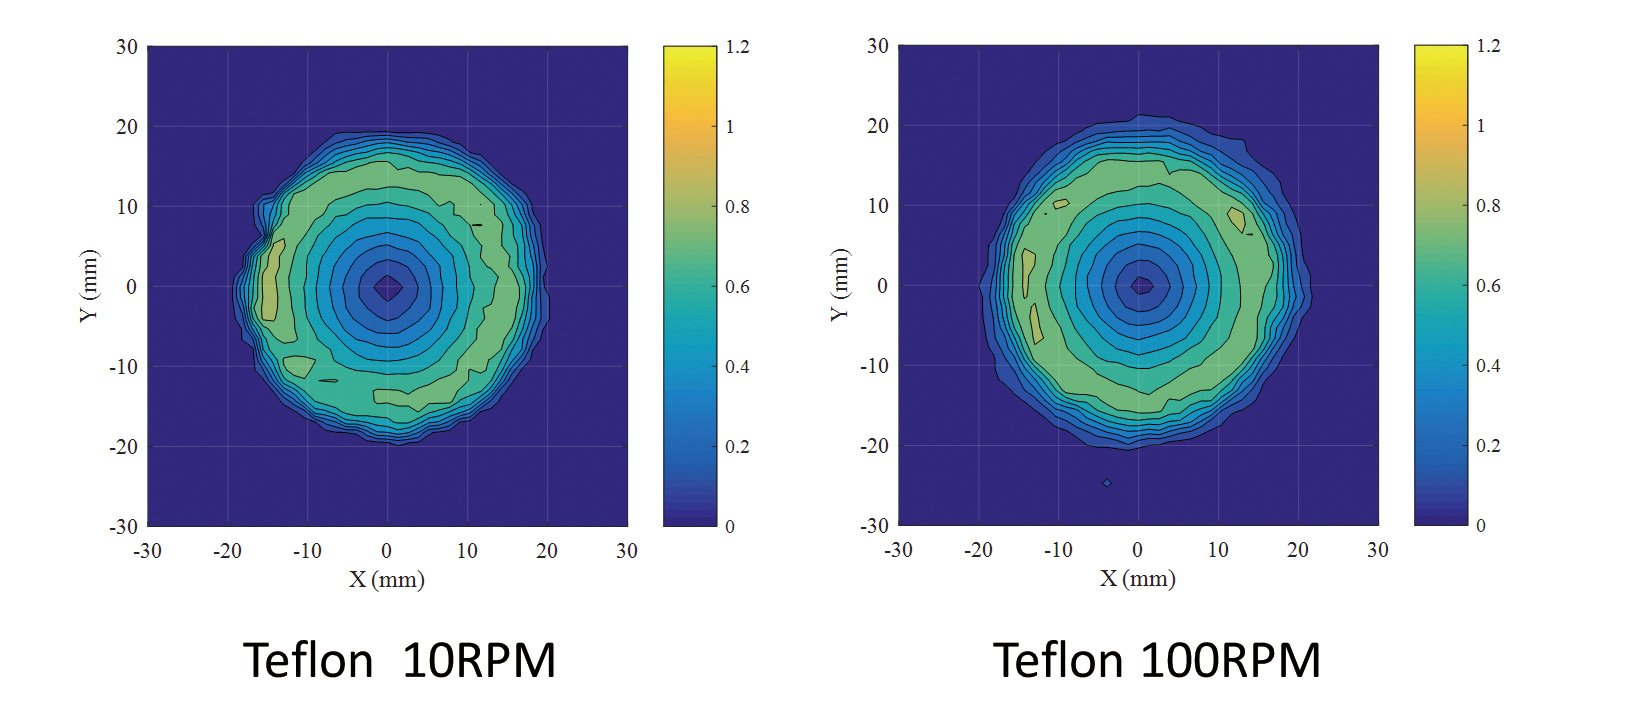
Figure 3.
Velocity distribution (Velocity was normalized with the rotational speed of the vane tip.) Deformed area expands with increasing rotational speed of the vanes (right figure).

Creating technologies that Contribute to the World
National Institute of Maritime, Port and Aviation Technology
Port and Airport Research Institute
3-1-1 Nagase,Yokosuka City, Kanagawa Prefecture, 239-0826 Japan Phone +81-46-844-5010
Copyright © Port and Airport Research Institute. All rights reserved.