
Major Research Applicability of geostatistics for streamlining maintenance
For maintenance of concrete structures in ports, coring and concentration measurement of chloride ions are sometimes performed to confirm the state of penetration of chloride ions. However, the severe work environment and the long length of port structures make it difficult to conduct an adequate number of surveys. So, it is difficult to determine the deterioration condition of an entire structure.
Therefore, if information from limited-area surveys allows us to recognize the state of penetration of chloride ions for an entire structure, it may be possible to identify areas where focused reviews are required. In this research, first we investigated the necessary number of measurements for estimating the concentration distribution of chloride ions which are present on the surface of pier floorboards.
On pier floorboards which have been used for approximately 30 years after the structure entered into service, we measured chloride-ion concentrations at 63 locations and calculated the concentration of surface chloride ions (C0) and apparent diffusion coefficient (Dap). For the resulting C0, we used kriging, which is a geostatistics method, to estimate the distribution of C0 on an overall floorboard. For data of N points (N = 5, 10, 15, ..., 45), which had been randomly selected from data of the 63 measured points, we used kriging to estimate the distribution of C0, and calculated mean square errors (MSE) between the results and C0 distribution which had been estimated using the overall data (Figure 1). We repeated this calculation for each N point 2000 times, then analyzed the estimated accuracy of the distribution for each number of measurements.
As a result, we found that the greater the number of data, the smaller the MSE becomes (Figure 2); however, we could not conclude how many measurements are necessary for estimating the distribution of C0. Hereafter, we will conduct the same investigation on other floor slabs to increase actual data. We will also conduct simulations regarding the necessary number of measurements for estimating the distribution of C0.
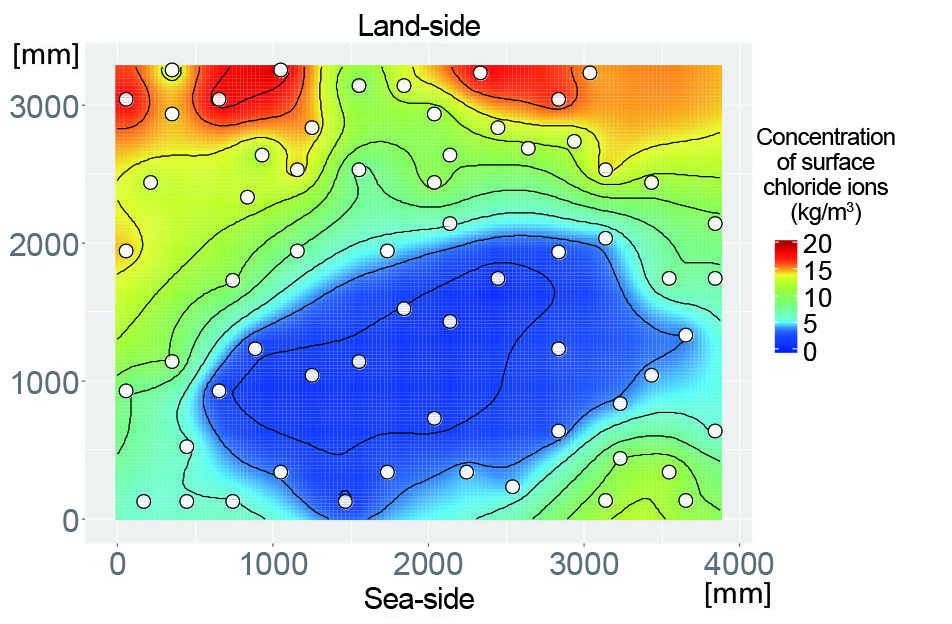
Figure 1.
Estimated concentration distribution of surface chloride ions(overall data; white circles represent measured points)
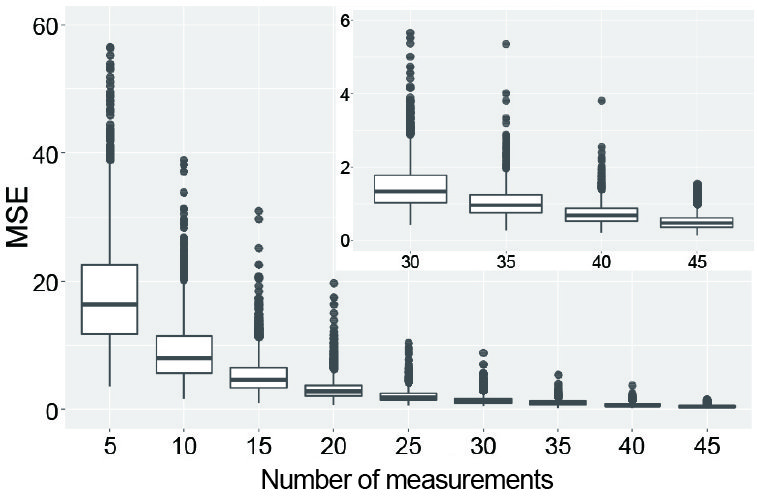
Figure 2.
Estimated error for each number of measurements

Creating technologies that Contribute to the World
National Institute of Maritime, Port and Aviation Technology
Port and Airport Research Institute
3-1-1 Nagase,Yokosuka City, Kanagawa Prefecture, 239-0826 Japan Phone +81-46-844-5010
Copyright © Port and Airport Research Institute. All rights reserved.