
Marine Environment Control System Department
Ferry Observation (Ise Bay)
Ferry Observation at Ise Bay :Data Catalogue
Catalogue
Precautions for use
- The catalog file format is MP4.The catalogue data are available for download by right clicking on the period.
- Downloaded files are free to use, but please do not redistribute. If you use these data to make an academic conference presentation or a paper presentation, please contact us.
- To obtain the raw data, please contact us. We will decide whether to offer the data by asking the purpose of using.
Overview
Ise Bay Ferry, Ise-maru
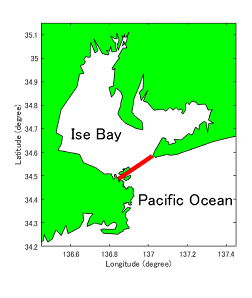
The Ise Bay Ferry takes about 55 minutes for 20 km between Toba Port at Mie and Irako Port at Aichi (inside the red frame on the right figure).
Ise Bay Ferry is usually operated 8 to 9 navigations per day with another ferry.
However, if one ferry is in the dock, it will be different from usual time table. And it may have canceled at stormy weather.
We have set equipment in the Ise-maru, and observe flow and water quality of Ise Bay.
Flow observation
- ADCP (Acoustic Doppler Current Profiler), WH-ADCP mariner (300kHz) made by Teledyne RD instruments, is used for flow observation.
- The water draft of Ise-maru with ADCP equipment installed is about 3.0 m.
- We measures 4 m layers from 7.2 m below ADCP in the vertical direction.
- Periodic inspections are conducted once a year.
Water quality observation
- Water quality is measured by introducing the seawater taken from the intake at the bottom of the ferry to the water quality measurement system in the ferry.
- The water draft of Ise-maru is 3.0 m, which is the layer of water quality observation.
- Measurement items are salinity and water temperature (Excell Thermosalinograph,FSI) .
- Salinity and water temperature are measured at places that passed pipes several tens of meters from the intake.
- Measurement results are recorded at one second intervals.
- Periodic inspections, cleaning and calibration of the sensor section are conducted once a year.
Drawing method
Horizontal flow velocity
- It shows the horizontal flow velocity of the top layer and 2nd layer.
- "Top layer" is a layer 4m from the water surface approximately 7.1 + 3.0 m and 2nd layer is 4 m below from "Top payer".
- Horizontal flow velocity is extracted by extracting data from the STA file outputted on average for 30 seconds by the "VM-DAS" software, and subtracting the boat speed measured by the bottom track function. However the extracted horizontal flow velocity data with a ping correlation of 110 counts or less are rejected, and the rejected measurement locations are indicated by crosses.
Water quality
- Salinity and water temperature are the results measured at one second intervals. The correction of the measurement result is not carried out.
- It takes a few minutes for the taken seawater to reach the measurement point of salinity and water temperature.
- "Departure time" in the figure is the start time of measuring the water quality, and it is diffrent from the actual departure time of the ferry.
Acknowledgments
- This observation is carried out thanks to the setting of our equipment on Ise-maru. We received a lot of cooperation from Ise Bay Ferry Co.,Ltd.
- The drawing system of observation result was developed by students of Osaka CIty University and Yokohama National University.
- We appreciate all the support we received from all concerned parties.
References
- Kojiro SUZUKI, Yoshiyuki NAKAMURA and Yoji TANAKA:Monitoring Program for Water Quality and Current at the Mouth of Ise Bay using a ferry,Technical Note of Port and Airport Research Institute,No.1199,2009.

Creating technologies that Contribute to the World
National Institute of Maritime, Port and Aviation Technology
Port and Airport Research Institute
3-1-1 Nagase,Yokosuka City, Kanagawa Prefecture, 239-0826 Japan Phone +81-46-844-5010
Copyright © Port and Airport Research Institute. All rights reserved.