
Ferry Observation (Tokyo Bay)
Overview
Tokyo Bay Ferry, Kanaya-maru
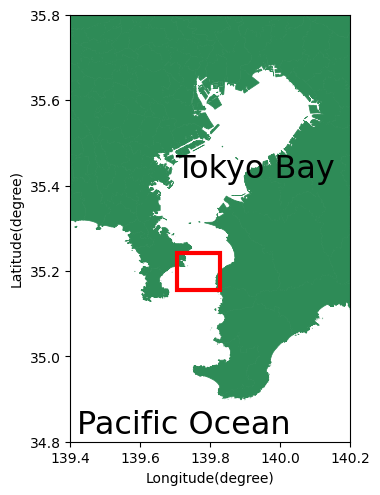
The Tokyo Bay Ferry takes about 40 minutes for 10 km between Kurihama Port and Kanaya Port (inside the red frame on the right figure).
Kanaya-maru is usually operated 12 to 14 navigations per day with another ferry.
However, if one ferry is in the dock, it will be different from usual time table. And it may have canceled at stormy weather.
We have set equipment in the Kanaya-maru, and observe flow and water quality of Tokyo Bay.
Flow observation
ADCP (Acoustic Doppler Current Profiler), WH-ADCP mariner (300kHz) made by Teledyne RD instruments, is used for flow observation.
The water draft of Kanaya-maru with ADCP equipment installed is 3.4 m.
We measures 4 m layers from 7.2 m below ADCP in the vertical direction.
Periodic inspections are conducted once a year.
Water quality observation
Water quality is measured by introducing the seawater taken from the intake at the bottom of the ferry to the water quality measurement system in the ferry.
The water draft of Kanayamaru is 3.4 m, which is the layer of water quality observation.
Measurement items are salinity (ETSG 2, manufactured by Falmouth Scientific Inc.), water temperature (SBE 38, manufactured by SEA-BIRD Co.) and chlorophyll concentration (WETStar, manufactured by WETLabs).
Water temperature is measured near the intake of the ferry.
Observation results
Latest dataWe have released observational data for the most recent voyage. The data includes upper layer current speed (at a depth of 11 meters, in red) and fifth layer current speed (at a depth of 25 meters, in blue), ocean surface wind (in light blue), and water quality data (salt content, water temperature, chlorophyll from top to bottom). The tidal level data (bottom left) is based on information from the Meteorological Agency.
Weekly data
We have been releasing video footage of observation results from seven days ago until yesterday.
Past data
Please refer to the following for past data.
Drawing method
horizontal flow velocityIt shows the horizontal flow velocity of the top layer.
"Top layer" is a layer 4 m from the water surface approximately 10.6 m.
Horizontal flow velocity is extracted by extracting data from the STA file outputted on average for 20 seconds by the "VM-DAS" software, and subtracting the boat speed measured by the bottom track function. However the extracted horizontal flow velocity data with a ping correlation of 110 counts or less are rejected, and the rejected measurement locations are indicated by crosses.
The aspect ratio of the plotting area is based on distance.
Water qualitySalinity, water temperature and chlorophyll concentration are the results measured at one minute intervals. The correction of the measurement result is not carried out.
It takes a few minutes for the taken seawater to reach the measurement point of watertemperature, salt content and chlorophyll consentration. Empirically, the arrival time to the temperature measurement point is 1min, and the arrival time to the salinity and chlorophyll conventration measurement point is 3 min. Drawing latitude is corrected according to arrival time.
"Departure time" in the figure is the start time of measuring the water quality, and it is different from the actual departure time of the ferry.
"Flow" in the figure shows the flow of sea water in the water measurement system. If it is approximately 1.0 L min - 1 or more, water quality can be measured without a big hindrance, but if it is less than 1.0 L min-1, there is a possibility that the measurement could not be performed normally due to clogging of dust etc. in the equipment.
Acknowledgments
This observation is carried out thanks to the setting of our equipment on Kanaya-maru. We recieved a lot of cooperation from Tokyo Bay Ferry Co.,Ltd.
The drawing system of observation result was developed by students of Osaka City University, Kobe City College of Technology and Milano Institute of Technology.
The tide level data of Kurihama is provided by the Marine Information Group.
The tide level data of Mera is based on data from the Meteological Agency.
We appreciate all the support we received from all concened parties.
References
Kojiro Suzuki : Influence of freshwater inflow and wind on seawater exchange and poor oxygenation in Tokyo Bay, Port and Airport Research Institute, No.1276, 2013.9.

Creating technologies that Contribute to the World
National Institute of Maritime, Port and Aviation Technology
Port and Airport Research Institute
3-1-1 Nagase,Yokosuka City, Kanagawa Prefecture, 239-0826 Japan Phone +81-46-844-5010
Copyright © Port and Airport Research Institute. All rights reserved.